This post may contain affiliate links, which means I’ll receive a commission if you purchase through my links, at no extra cost to you. Please read full disclosure for more information.
WHAT IS BREAK-EVEN ANALYSIS?
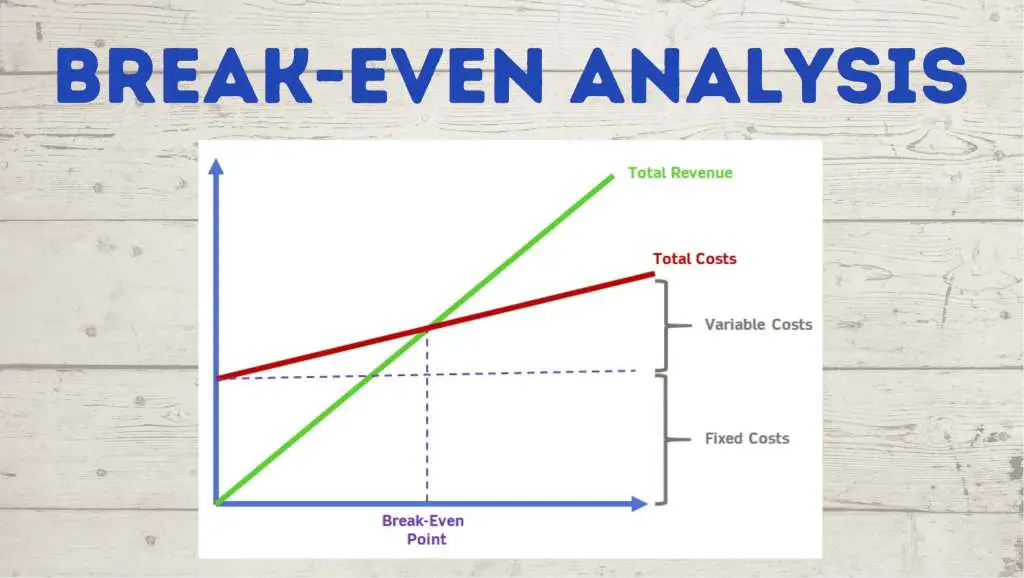
Break-even analysis is a type of analysis that identifies where a product, service, or business will reach the point of total costs equaling total revenues. The analysis finds the break-even point (BEP) which is the level of units or dollars of revenue required for an endeavor to recover its total costs.
At the break-even point, there are neither profits nor losses. Sales above the break-even point will result in profit and sales below the break-even point will result in losses.
When entrepreneurs and businesses conduct a break-even analysis, they want to answer the question, “How many sales/dollars do we need in order to make our money back and become profitable?”
The analysis will reveal the minimum required to avoid losses.
WHEN TO USE BREAK-EVEN ANALYSIS
Break-even analysis is used when starting a new business, launching a new product or service, or adding a new sales channel to the mix.
Simply put, the analysis is used when a business is considering introducing something new and wants to know what profitability will look like. Break-even analysis can reveal the following about a product:
- Is the level of sales needed to profit plausible?
- Are our costs too high?
- Is our selling price per unit too low?
- What revenue targets do we need to set?
- Is pursuing this product or service worth it from a business standpoint?
Revenue vs Profits
When it comes to break-even analysis, it is important to distinguish the difference between revenue and profits.
They are not the same. Just because a business earns revenues through sales does not mean that the business is profitable. The revenues generated will offset the associated costs of producing and selling the product.
Profit is achieved when revenues exceed the fixed and variable costs. The break-even analysis formula will determine what level of output will achieve this.
BREAK-EVEN ANALYSIS FORMULA AND CALCULATION

A break-even analysis can be conducted two ways depending on what you are interested in finding out:
- Do you want to know the BEP in quantity?
- Do you want to know the BEP in dollars?
You can run a break-even analysis to determine the quantity necessary to break even or you can determine the dollars and sales required.
Fixed costs, variable costs, and contribution margin
First, we will need to cover some must-know terms. Break-even analysis looks at the fixed costs a business has relative to the profit earned on each sale of a product or service.
Fixed Costs
Fixed costs are costs that will not change based on the output of sales or services. The costs are “fixed” and will have to be paid whether the business fails or succeeds.
Examples include rent, salaries, insurance, and property taxes.
Variable Costs
Variable costs are costs that fluctuate depending on the volume of products produced. Variable costs will increase when more products are produced and will decrease when less products are produced.
Examples include material costs and certain utilities. The more output that occurs in the business, the higher these costs will be. Each unit of product will have a level of variable costs associated with it.
Contribution Margin
Before we get into the formulas and calculations, it’s important to know what contribution margin is. Contribution margin is the excess between the selling price of a product or service and its total variable costs.
Contribution Margin = Sales Price Per Unit – Variable Cost Per Unit
The contribution margin is the amount that each product contributes to covering the total fixed costs.
For example, if a product sells for $100 and has variable costs of $30, the contribution margin would be $70. The $70 would be put to use to cover the fixed costs. Once fixed costs are covered, each additional unit sold will add $70 in profit.
Break-even point in quantity

Break-even quantity = Fixed Costs / (Sales Price Per Unit – Variable Cost Per Unit)
Notice how the denominator of the formula is the contribution margin. To calculate the break-even quantity, divide fixed costs by the contribution margin.
Break-even quantity = Fixed Costs / Contribution Margin
A business with lower fixed costs will have a lower break-even point, all else being equal.
Example
A business is thinking of launching a new style of sunglasses. The project would require a warehouse to manufacture the goods and employees to work.
The fixed costs for the warehouse are $1,000,000 and the salaries are $300,000. Total fixed costs are $1,300,000. The company will sell the sunglasses for $100 per unit and each unit has $30 of variable costs. To find the break-even point quantity, the equation would be:
BEP Quantity = $1,300,000 / ($100 – $30) = 18,571 units
The company would have to sell 18,571 units just to break even. Any sales above that amount will be profitable

Break-even point in dollars

The break-even point in dollars is the dollar amount of revenue needed to break even.
Break-even in dollars = Fixed Costs / Contribution Margin Ratio
To calculate the break-even point in dollars, you will take fixed costs and divide it by the contribution margin ratio (not contribution margin). The contribution margin ratio is the contribution margin per unit divided by the sales price per unit.
Contribution Margin Ratio = Contribution Margin / Sales Price Per Unit
Example
To calculate the break-even point in dollars, the first step is to find the contribution margin ratio. We will use the same numbers from the previous example:
- Warehouse = $1,000,000
- Salaries = $300,000
- Sunglasses price per unit = $100
- Variable cost per unit = $30
The contribution margin is $70 for the pair of sunglasses. Now, we find the contribution margin ratio:
Contribution Margin Ratio = $70 / $100 = 70%
The contribution margin ratio is 70%. We will divide the total fixed costs amount ($1,300,000) by 70%.
Break-even in dollars = $1,300,000 / 70% = $1,857,142
The conclusion: The company will need $1,857,142 in sales revenue to break even.

HOW TO INTERPRET THE BREAK-EVEN ANALYSIS
The results of your break-even analysis can reveal positive or negative things about the product or service:
Selling price and sales volume
The analysis can help business owners determine if their selling price is appropriate to stay competitive and still achieve profitability.
In order to achieve higher profits, a business can increase the selling price per unit, but that will only work up to a certain point. If the price is too high, customers may not purchase the product at all. It’s important to balance selling price and sales volume.
Fixed costs
When looking at the break-even analysis, a business may realize that their fixed costs are just too high. When fixed costs are high, a business needs a high volume of sales to cover their costs.
If fixed costs happen to be too high, a company can do things such as reduce fixed payroll and negotiate lower rent prices.
Variable costs
Maybe fixed costs are fine, but variable costs are too high. When the variable cost per unit is high, the contribution margin of a product shrinks.
If the contribution margin is low, companies will try to reduce variable costs. This can include reducing variable labor costs and sourcing materials for cheaper prices from different suppliers.
BENEFITS OF BREAK-EVEN ANALYSIS

Identifies the point of profitability
The obvious benefit of this analysis is identifying the point of profitability for a new product or service.
Before committing to the launch of a new product, an entrepreneur can use a break-even analysis to get an idea of what volume of sales will generate profitability. The variables of the break-even calculation can be adjusted to achieve profitability in line with the entrepreneur’s expectations.
Points out cost inefficiencies
If the sales price per unit is set and the break-even analysis shows that an infeasible amount of sales are required to make a profit, the analysis can point out cost inefficiencies.
A company’s fixed costs and/or variable costs may be too high. These costs might have seemed normal prior to the analysis, but once the analysis was conducted, it revealed inefficiencies that need to be addressed.
If costs can be lowered without a sacrifice in quality, this helps the overall business.
Helps with pricing strategy
Pricing strategy is important when a business launches a new product. They have to make sure they are able to compete on pricing. The business doesn’t want to price their product too high or too low.
Running a break-even analysis can be used in decision making for pricing. Managers will look at the break-even analysis and determine if they can adjust sales price per unit.
If the analysis shows that profitability can be easily achieved, the business could potentially lower their sales price per unit to undercut the competition and increase sales volume.
Can be used to avoid financial strain
A poor decision of launching an unsuccessful product can cause financial strain. One way to prevent an unsuccessful product is by identifying the break-even.
By taking a small amount of time prior to launching to run this analysis, time and money can be saved by identifying products that aren’t likely to meet standards or perform.
LIMITATIONS OF BREAK-EVEN ANALYSIS

Requires an accurate assessments of costs
An analysis like this is only as good as its assumptions.
To run a useful break-even analysis, you will need to have an accurate assessment of costs. All fixed costs and variable costs need to be identified or business decisions may be made with incomplete information.
Demand may or may not be strong
Break-even analysis handles the supply side but does not consider the demand side. A business must have a good idea of what demand is likely to be like.
If your break-even analysis requires you to sell 100,000 units to break even, you have to be sure you are capable of selling that many units. There may only be enough demand to sell 75,000.
Analyze the market conditions alongside the break-even analysis.
Does not reveal impact on other products in the business
Introducing a new product or service risks the cannibalization of other products within the same business.
For example, if a company sells mobile phones, introducing a new phone model can hurt the revenue figures of the existing phone models.
Break-even analysis does not consider the impacts that a new product can have on the rest of the business. The analysis may return positive results for the single product, but a business needs to look at the big picture and find out if the product would be a positive for the company as a whole.
Does not take into consideration economies of scale
A basic break-even analysis does not consider the effects of economies of scale. As the number of units produced and sold increases, costs per unit are likely to decline due to economies of scale.
Knowing how these costs might reduce could make the difference between pursuing an opportunity or not.
SUMMARY
A break-even analysis is a type of analysis to identify the point, in units sold or dollars, that the costs of launching a new product or service will be recovered.
At the break-even point, there are no losses or profits. It is simply the point where all costs are recovered to break even, as the name would imply. Units sold above the break-even point will result in profits and units sold below the break-even point will result in losses.
This type of analysis is commonly used as a starting point for entrepreneurs and businesses to look at the profitability of a new launch.
Four factors that will be looked at include sales price per unit, sales volume, fixed costs, and variable costs per unit.
About Post Author
Brandon Hill
I'm Brandon Hill with Bizness Professionals. We serve content to help young professionals develop personally, professionally, and financially. Well-rounded improvement is a theme we live by. As such, this website will cover a variety of topics aimed to help you have a successful life and career.