This post may contain affiliate links, which means I’ll receive a commission if you purchase through my links, at no extra cost to you. Please read full disclosure for more information.
Financial ratios are used by the investment community to analyze a company’s finances.
The ratios are built from items coming from a company’s income statement, balance sheet, and statement of cash flows.
There are many different financial ratios held within 5 main categories:
- Performance
- Efficiency
- Liquidity
- Leverage
- Valuation
Using financial ratios, you can begin to dissect a company’s reported financial numbers and get a picture of aspects of the business to make educated investment decisions.
You can answer questions like:
- How much of a company’s revenue ends up turning into profit?
- Is a company selling its inventory quickly and are they collecting payments quickly?
- Does the company have enough cash to pay off its current liabilities due within a year?
- Is this company too levered and at risk?
- Is this company under-valued or over-valued?
Financial ratios are only effective for analysis when you compare them versus other companies, industries, and benchmarks.
You’ll also need to compare them for a company at different points in time as well.
In this section below, we’ll walk through the main financial ratios contained within the 5 categories.
I’ll tell you what they are, how to calculate them, what they mean, and how you can interpret them.
PERFORMANCE RATIOS
Performance ratios analyze a company’s financial performance.
Net Profit Margin Ratio
Net Profit Margin Ratio = Net Income / Revenue
- Amount of net income or profit generated as a percentage of revenues
- Higher is better as it implies that much of a company’s revenue will end up turning into profit.
Gross Profit Margin Ratio
Gross Profit Margin Ratio = Gross Profit / Revenue
- Amount of gross profit generated as a percentage of revenues
- Higher is better for the same reason as above. A high gross profit margin implies that a large amount of revenue will end up becoming gross profit.
- Gross profit can be increased by raising prices and increasing revenues or lowering expenses
Operating Profit Margin Ratio
Operating Profit Margin Ratio = Operating Profit (or EBIT) / Revenue
- Amount of operating profit generated as a percentage of revenue
- Higher is better for the same reasons as a high net profit and gross profit margin ratio
- Operating profit can be increased by increasing revenues or lowering expenses
Return on Assets (ROA) Ratio
Return on Assets (ROA) Ratio = Net Income / Assets
- Amount of profit generated as a percentage of the company’s total assets
- Tells you how good a company is at managing its assets by determining how much profit they generate with their assets
- A higher ratio is better
Return on Invested Capital (ROIC) Ratio
Return on Invested Capital (ROIC) Ratio = Net Operating Profit After Tax (NOPAT) / Invested Capital
- Tells investors how much profit is being generated as a percentage to the amount they invested
- It shows how efficiently a company is using invested funds to generate a profit
- Higher is better and a high ROIC has a high correlation to positive stock performance
Return on Equity (ROE) Ratio
Return on Equity (ROE) Ratio = Net Income / Total Equity
- The amount of profit generated from the amount of equity of a company
- A higher ratio is better and should be compared to other companies within the industry to analyze if it is above, at, or below the average
EFFICIENCY RATIOS
Efficiency ratios analyze how efficiently a company is at managing its assets and resources.
Accounts Receivable Turnover Ratio
Accounts Receivable Turnover Ratio = Sales / Accounts Receivables
- Tells you how effective a company is in collection of receivables (or money owed to the company)
- A high ratio shows that the company is conservative in the credit it lends out and has efficient systems in place for collection of funds for that credit
- A low ratio can show that a company is too loose with the credit it gives out and is not able to get those funds back efficiently
Inventory Turnover Ratio
Inventory Turnover Ratio = Cost of Goods Sold (COGS) / Average Inventory
- Shows how effectively a company manages its inventory by turning inventory into sold goods
- A higher inventory turnover ratio is a positive sign because it means that a company is quickly selling its inventory and there is demand for their products
Accounts Payable Turnover Ratio
Accounts Payable Turnover Ratio = Net Credit Sales / Accounts Payable
- Shows the speed at which a company pays off its accounts payable amounts
- A high ratio shows that a company is quick to pay off people such as their suppliers
- If the ratio is low, it implies the company is slow to pay its suppliers and that slowing can be a reason of concern
Asset Turnover Ratio
Asset Turnover Ratio = Sales / Total Assets
- Total sales generated as a percentage of total assets of the company
- It shows the company’s efficiency in generating sales from its assets
- A higher ratio is better. When compared to another company, if Company 1 has a higher asset turnover ratio than Company 2, Company 1 shows to be more efficient at generating sales from its assets
Working Capital Turnover Ratio
Working Capital Turnover Ratio = Sales / Working Capital
- Total sales generated as a percentage of a company’s working capital
- Remember, working capital = current assets – current liabilities
- Therefore, the working capital turnover ratio shows how efficient a company is at using its current assets and current liabilities to produce sales
- A higher ratio is better
- A low ratio can imply that a company has too many assets in accounts receivable and inventory
Days of Sales Outstanding Ratio
Days of Sales Outstanding Ratio = 365 / Accounts Receivable Turnover Ratio
- Shows how many days it takes for a company to collect on payments after a sale has been made
- Lower is better for this ratio. A lower amount of days shows that a company is quick to collect on payments after it makes a sale
Days’ Sales in Inventory Ratio
Days’ Sales in Inventory Ratio = 365 / Inventory Turnover Ratio
- Shows the number of days it took a company to sell its inventory
- Lower is better. A lower number for days’ sales in inventory ratio shows that a company takes less days to sell its inventory, meaning that the inventory is liquid and not sitting on shelves
LIQUIDITY RATIOS
Liquidity ratios analyze a company’s ability to pay its short-term and long-term debt obligations.
Current Ratio
Current Ratio = Current Assets / Current Liabilities
- Shows the ratio of the amount of current assets a company has versus its amount of current liabilities
- A higher ratio is better because it shows a company has enough current assets to take care of its current liability obligations within 12 months
- A lower ratio can imply that a company will be at risk for distress or default on its short-term obligations
Quick Ratio
Quick Ratio = Current Assets – Inventory / Current Liabilities
- Another ratio to show a company’s ability to take care of its short-term liability obligations with its current assets
- Quick ratio is different from the current ratio because it strips out inventory from the numerator, which takes out one of a company’s most liquid form of assets
- The quick ratio shows the ability of a company to pay its current liabilities without the need to sell its inventory and can be a better gauge on a company’s ability pay its current liabilities than the current ratio
- Higher is better
Cash Ratio
Cash Ratio = Cash + Marketable Securities + Receivables / Current Liabilities
- The cash ratio shows a company’s ability to pay its current liabilities with its cash or near cash resources
- This ratio is a more conservative liquidity ratio compared to the current ratio and quick ratio because it shows the most liquid resources a company has to pay off short-term liabilities
- A higher ratio is better
Operating Cash Flow Ratio
Operating Cash Flow Ratio = Operating Cash Flow / Current Liabilities
- The operating cash flow ratio shows the ability for a company to pay off its current liabilities with its operating cash flow amount
- A higher ratio is better
- As an example, a operating cash flow ratio of 4.5 would mean that a company could pay off its current liabilities 4.5 with its operating cash flow amount 4.5 times
LEVERAGE RATIOS
Leverage ratios analyze the amount of capital a company has coming from debt and if there is potential for risk.
Debt Ratio
Debt Ratio = Total Debt / Total Assets
- Shows how much debt a company has relative to its assets
- A ratio of greater than one shows that a company has more debt than it does assets
- This can heighten the risk of a company as the debt ratio increases
- A lower debt ratio is usually better
Debt to Equity Ratio
Debt Ratio = Total Debt / Total Shareholders’ Equity
- Shows the amount of debt compare to the shareholder’s equity of the company
- A higher ratio shows that a company is using more funds from debt than funds from investors
- A lower ratio is better
Debt to Capital Ratio
Debt to Equity Ratio = Total Debt / (Total Debt + Total Shareholders’ Equity)
- Shows the company’s amount of debt relative to its total amount of capital
- Gives insight on a companies financial structure
- A lower number is better, as it implies less risk with a company having less debt relative to its total capital amount
Interest Coverage Ratio
Interest Coverage Ratio = Operating Income (EBIT) / Interest Payments
- Amount of operating income or EBIT relative to the interest payment obligations of a company
- A higher interest coverage ratio is better as it shows that a company is capable of paying its interest payments
- An interest coverage ratio of 4 would mean that a company can pay its interest payments with its EBIT amount 4 times over
Debt Service Coverage Ratio (DSCR)
Debt Service Coverage Ratio (DSCR) = Operating Income (EBIT) / Total Debt Service
- Amount of EBIT relative to the total debt obligations of a company
- A higher ratio is better and shows how much EBIT is available to pay its total debt service
- Like the example with interest coverage ratio, a DSCR of 4 would mean that a company can pay its total debt service 4 times over with its amount of EBIT
VALUATION RATIOS
Valuation ratios are used to try to determine the value of a company.
Price to Earnings (P/E) Ratio
Price to Earnings (P/E) Ratio = Price per Share / Earnings per Share (EPS)
- Used for valuing a company based on the price per share on its stock versus the earning per share earned by a company
- When a P/E ratio is high relative to historical values or an industry average, it implies that a stock is over-valued or expensive
- A high ratio would mean that a stocks price per share is much higher than its earnings amount per share
- A low ratio implies that a stock is under-valued or cheap
Price to Cash Flow (P/CF) Ratio
Price to Cash Flow (P/CF) Ratio = Price per Share / Operating Cash Flow per Share
- A valuation ratio measuring a companies stock price verse its amount of operating cash flow per share
- It shows how much operating cash flow a company can generate relative to its stock price
- Some like to use it over the P/E ratio because EPS can be manipulated through accounting, but cash flow cannot be altered as easily
Price to Sales (P/S) Ratio
Price to Sales (P/S) Ratio = Price per Share / Total Sales per Share
- Shows the price per share of a company versus the sales amount per share a company generates
- It shows the amount you would pay per share to generate $1 of sales from that stock
- P/S ratio doesn’t take into account earnings or profitability
- A P/S ratio of 5 would mean you are paying $5 for a stock to generate $1 in sales
- A lower ratio implies you are getting a good deal on the price of a stock for $1 in sales
Price to Earnings to Growth (PEG) Ratio
Price to Earnings to Growth (PEG) Ratio = P/E Ratio / EPS Growth Rate
- Shows a company’s P/E ratio versus the growth rate of its earnings per share (EPS)
- It is used for valuation while also taking into account a company’s earnings growth
- A higher PEG ratio is associated with an over-value or expensive stock
- A lower PEG ratio is associated with a under-valued or cheap stock
Price to Book Value Ratio
Price to Book Value Ratio = Price per Share / Book Value Per Share
- Shows the price per share of a stock relative to is book value per share of stock
- book value = total assets – total liabilities
- Higher generally means a stock is over-valued and a lower ratio means it is undervalued
Dividend Yield Ratio
Dividend Yield Ratio = Annual Dividend / Share Price
- Shows the annual dividend issued by a company versus its share price
- Higher dividend yields are generally attractive, but not at the expense of of the denominator (share price) decreasing and causing the higher dividend yield
Dividends Per Share (DPS) Ratio
Dividends per Share (DPS) Ratio = Total Dividends / Shares Outstanding
- Shows the amount of dividends versus the amount of shares outstanding
- This ratio will shows investors the amount of dividends they will receive per share of stock
- If you are investing for the purpose of receiving dividends, a higher DPS is attractive
- A lower DPS does not necessarily raise a red flag. It could mean that the company is using funds to reinvest into itself rather than pay dividends. This reinvestment could lead to a larger increase in value of your holdings that the dividend you could have received instead
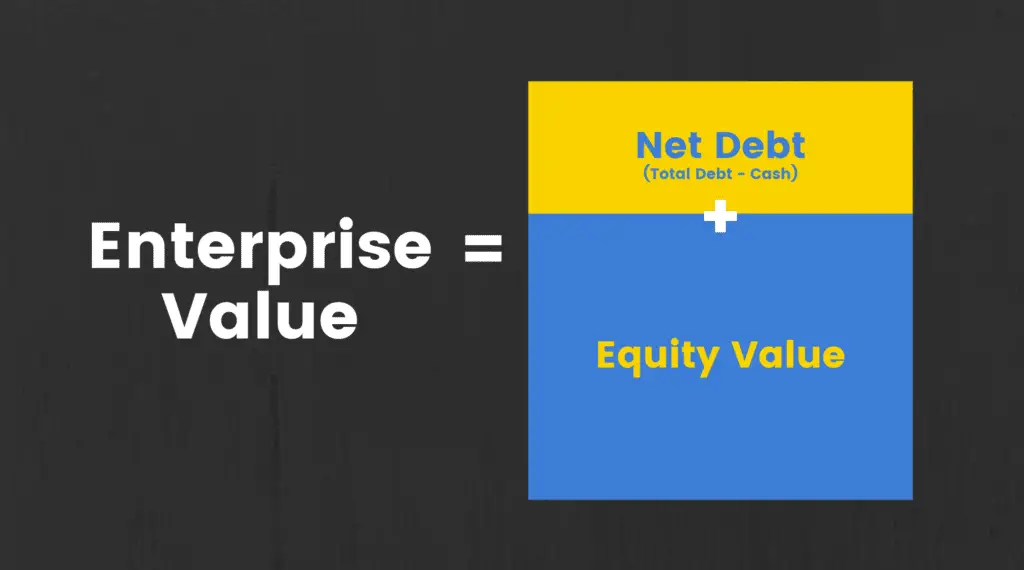
Enterprise Value to EBITDA (EV/EBITDA) Ratio
Enterprise Value to EBITDA (EV/EBITDA) Ratio = EV / EBITDA
- A commonly used valuation ratio showing the entire value of a company versus the amount of EBITDA the company generates
- Used for valuation by those looking to acquire a company because it takes into account the value of debt. If you purchase a company, you are purchasing the equity and debt
- Enterprise Value (EV) = market value of equity + market value of debt – cash or cash equivalents
- EBITDA stands for Earnings Before Interest Taxes Depreciation and Amortization
- Lower ratios are seen as under-valued and higher ratios are seen as over-valued
Enterprise Value to Sales (EV/Sales) Ratio
Enterprise Value to Sales (EV/Sales) Ratio = EV / Sales
- This ratio is used to value a company by looking at its enterprise value versus the sales generated
- It is seen as a more accurate predictor of valuation than the price to sales (P/S) ratio because EV/Sales takes debt into consideration as well
- Lower ratios are seen as under-valued and higher ratios are seen as over-valued
About Post Author
Brandon Hill
I'm Brandon Hill with Bizness Professionals. We serve content to help young professionals develop personally, professionally, and financially. Well-rounded improvement is a theme we live by. As such, this website will cover a variety of topics aimed to help you have a successful life and career.